28 Day Sales Average
Daily sales data drives business decisions, but raw numbers create more confusion than clarity. A 28-day rolling sales average filters out chaos to reveal your actual business trajectory.
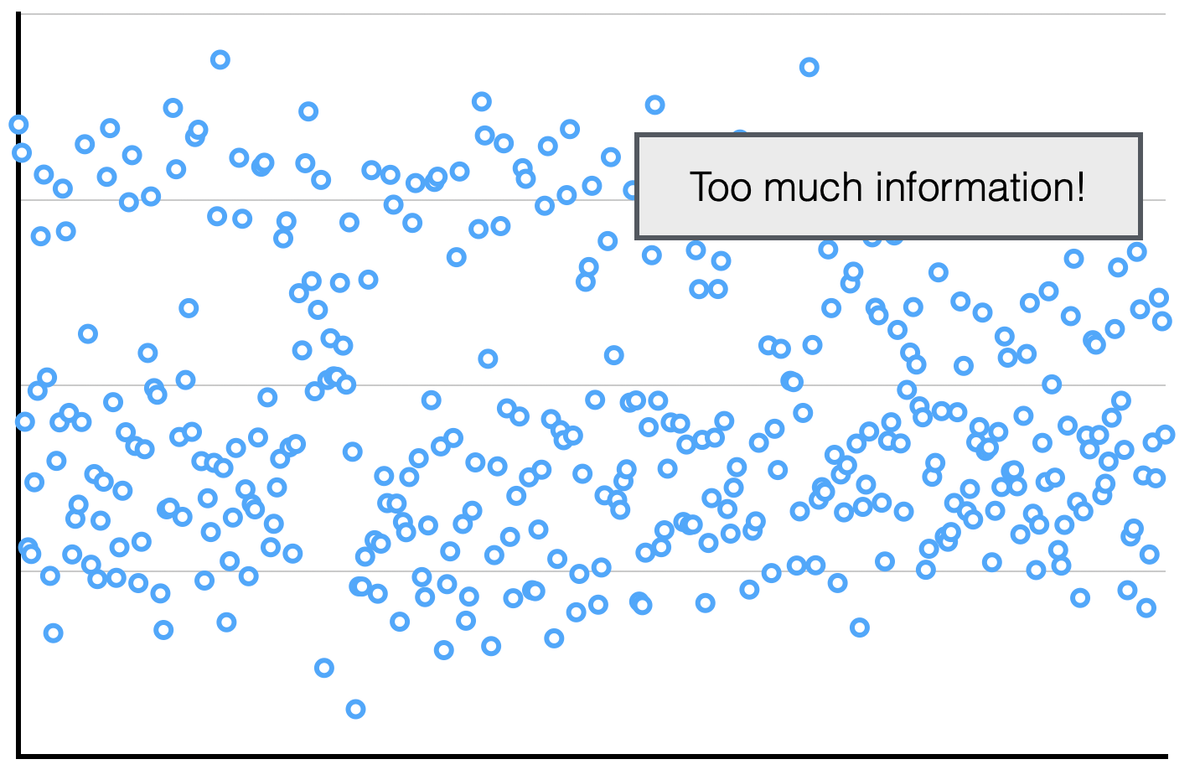
Daily sales data drives business decisions, but raw numbers create more confusion than clarity. A year’s worth of daily sales, 365 data points, is valuable information, but chaotic, so it’s hard to discern patterns and extract any useful conclusions. We can produce patterns from the chaos by grouping the data.
The problem with monthly reporting
Traditionally, business likes monthly reporting. For retail sales, this has limited value.
Information Gap
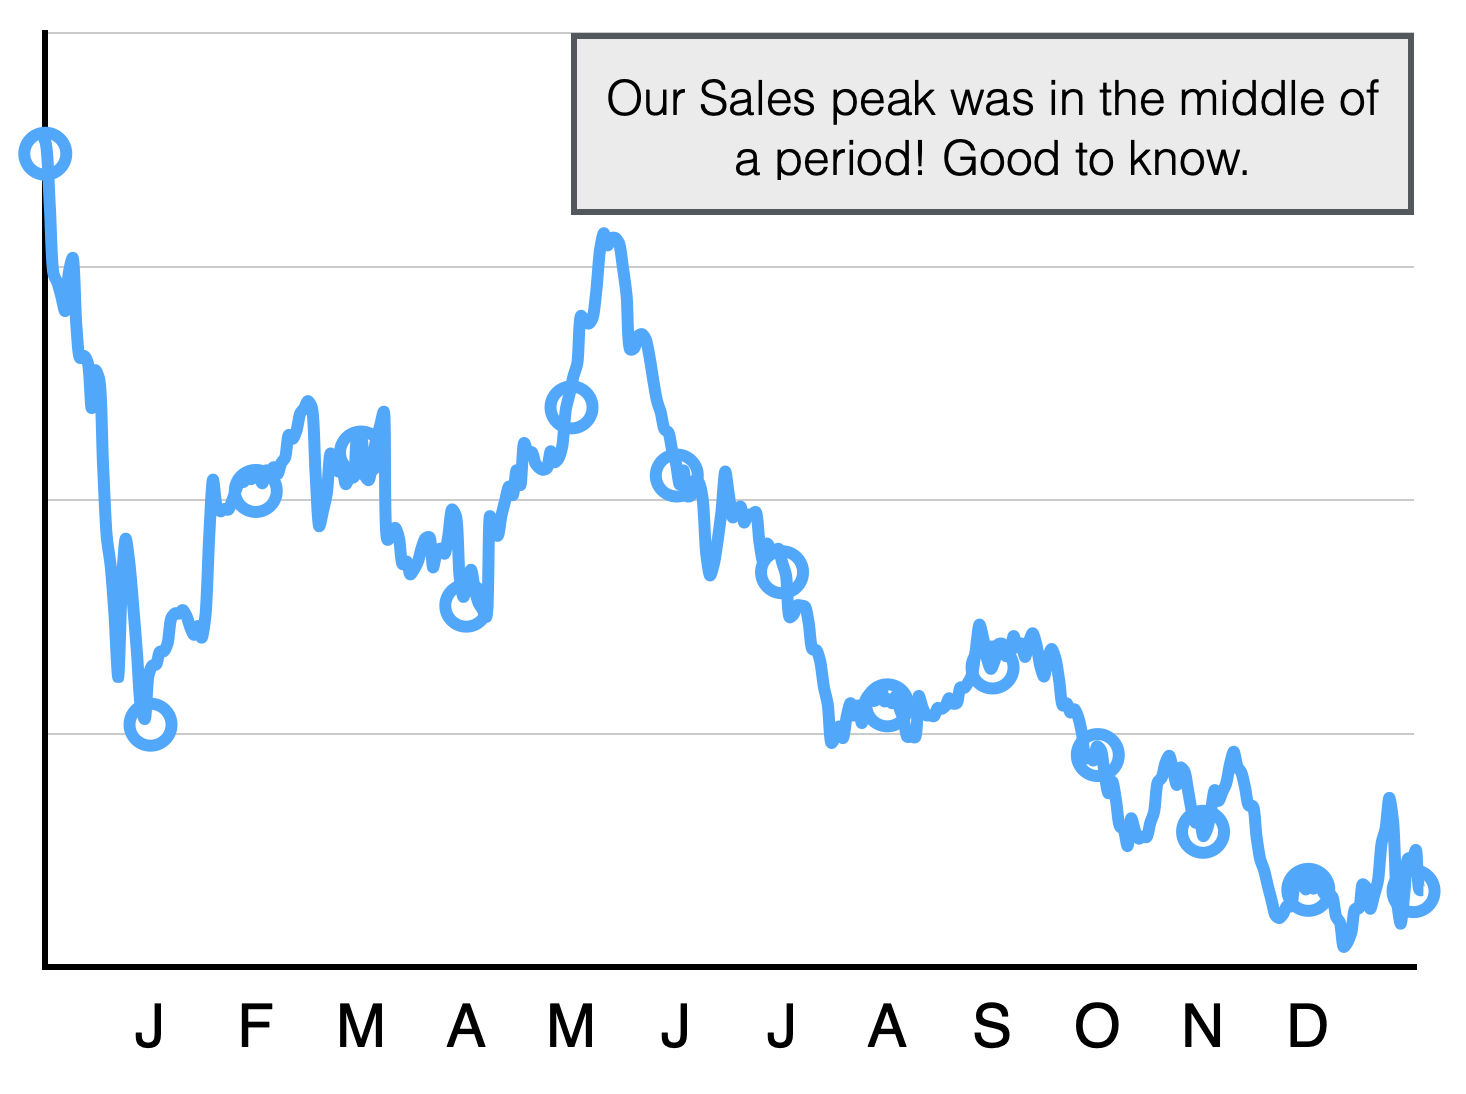
Grouping sales into months, we reduce 365 points down to 12, extracting meaning, but losing detail. In between each period we have an information gap. We know our daily sales, but have to wait 4 weeks for the next summary figure.
You can’t compare January and February
Calendar months have different number of days and weekends. Restaurants sales follow a weekly cycle so comparing a month with 5 weekends to one with 3 produces no insights. Calendar months don’t compare well to one another.
The power of a 28 day rolling average
Every 28 day period has the same number of days and weekends - regardless of the day of the week we start the period. This allows us to calculate a 28 day average for every day of the year and compare any period to another. This gets us back up to 365 data points for the year - eliminating both the information gap and the comparison issue.
A 28-day rolling sales average filters out chaos to reveal your actual business trajectory - transforming noisy daily retail data into actionable intelligence. It smooths volatility, helps visualize information, identify trends, improves forecasting accuracy, and enables better decisions across inventory, staffing, and marketing.
Valuable Forecasting Tool
An established restaurant follows remarkably predictable sales patterns. Overlaying the current 28 day average on last year’s provides valuable insight into upcoming sales. Last year’s trends are an excellent forecasting tool for future sales.
Smarter Inventory Decisions
Retailers often over-order after strong sales days or under-order after weak ones. The rolling average prevents these emotional purchasing decisions by showing consistent demand patterns. Your buyers can focus on genuine trends rather than chasing ghosts.
Better Staffing Predictions
Scheduling becomes less guesswork when you can see genuine traffic patterns rather than reacting to last week's anomalies. The rolling average helps predict when you actually need more hands on deck.
Marketing ROI Clarity
Campaign effectiveness gets muddied by daily volatility. A 28-day view helps distinguish genuine marketing lift from statistical noise, leading to smarter ad spend allocation.
Cash Flow Confidence
Financial planning improves dramatically when based on smoothed trends rather than erratic daily figures. Banks and investors also prefer seeing consistent performance metrics over volatile daily reports.
A 28 day rolling average is a trivial thing to create in a spreadsheet. Or, BlackFox charts your 28 day rolling sales average for you, compares it to last year’s rolling average, and provides simple but powerful forecasting tools based on this information.